This is how Sheffield primary schools are ranked by the government


They are awarded scores reflecting their pupils' progress between KS1 and KS2 exams in three key subjects, taken at the ages of seven and 11.
Schools are ranked by the percentage of pupils meeting the expected standard in Reading, Writing and Maths as well as achieving '˜at a higher standard'.Â
Advertisement
Hide AdAdvertisement
Hide AdAcross the country, 64 per cent of 11-year-olds who sat this year's national curriculum tests, known as Sats, met the Government targets in all the three areas.Â
BBC have reported that only half of the poorest pupils in England are reaching their expected level in these tests, compared to 70 per cent for their richer peers.Â
And Press Association found that 91,620 pupils were being taught at 364 under-performing schools that had failed to meet the primary floor standard,Â
The government's '˜floor standard' for a primary school this year is 65 per cent of pupils achieving the expected standard in reading, writing and maths.Â
Advertisement
Hide AdAdvertisement
Hide AdThey are also considered to be under-performing if they fail to make sufficient progress in the three key areas.Â
In Sheffield, 58Â primary schools met the government's target of 65 per cent achieving '˜sufficient progress scores' in all three core subjects.Â
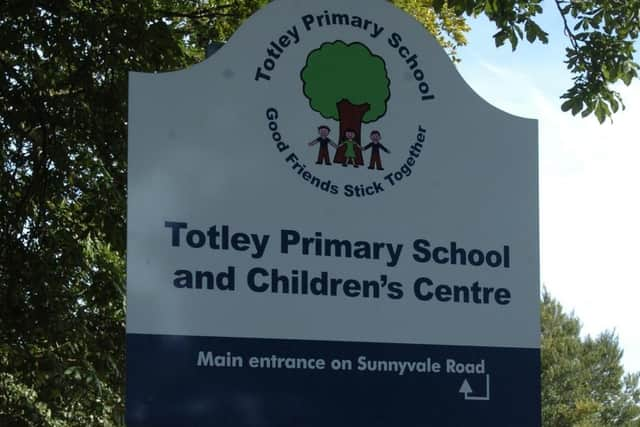
Totley Primary School had the highest percentage of pupils meeting the expected standard (94Â per cent) while Oasis Academy Fir Vale had the lowest percentage at 3 per cent.Â
However, in terms of overall performance and progress, Valley Park Community School came out on top.Â
Advertisement
Hide AdAdvertisement
Hide AdThese scores are calculated based on how much progress pupils at the school made in reading, writing and maths before the end of Key Stage 1 and the end of Key Stage 2.
This is compared to pupils across England who got similar results at the end of Key Stage 1.Â
The scores are calculated by comparing the Key Stage 2 test and assessment results of pupils at the school with the results of pupils in schools across England who started with similar assessment results at the end of the previous key stage '“ Key Stage 1.
A score above zero means pupils made more progress, on average, than pupils across England who got similar results at the end of Key Stage 1.
Advertisement
Hide AdAdvertisement
Hide AdA score below zero means pupils made less progress, on average, than pupils across England who got similar results at the end of Key Stage 1.
Hatfield Academy was found to be the worst performing school for progress with pupils '˜well below average' in reading and maths and '˜below average' in writing.Â
Click here to view the full list of all Sheffield schools.Â
Â